Stitch 1D overlapping signals

[1]:
import numpy as np
import matplotlib.pyplot as plt
import microscopy_data_analysis as mda
[2]:
#create testdata
testdata=np.random.normal(size=10000)

#sample the testdata with two different measurements
spectrum1,bins1=np.histogram(testdata,np.linspace(-2,0,68))

spectrum2,bins2=np.histogram(testdata,np.linspace(-0.5,5,200))
spectrum2 *= 5 #manipulate spectrum2 to have a different scale

#transform the upper and lower bin thresholds to central points
bins1=mda.bin_centering(bins1)
bins2=mda.bin_centering(bins2)

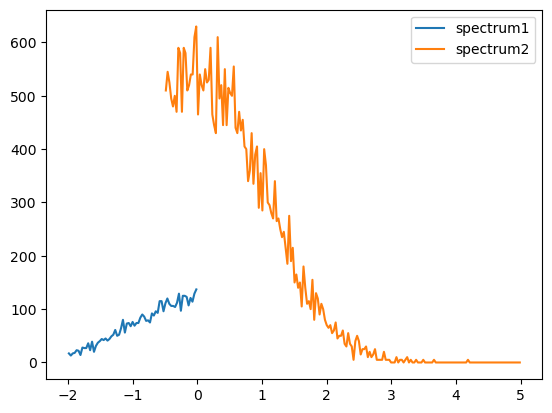
# show the two spectra
plt.plot(bins1,spectrum1,label='spectrum1')
plt.plot(bins2,spectrum2,label='spectrum2')
plt.legend()
plt.show()
../_images/1D_examples_stitch_overlap_2_0.png
[3]:
stitched_x,stitched_y=mda.stitch_1d_overlap(bins1,spectrum1,bins2,spectrum2,verbose=True)
plt.plot(bins1,spectrum1,label='spectrum1')
plt.plot(bins2,spectrum2,label='spectrum2')
plt.plot(stitched_x,stitched_y,label='stitched')
plt.legend()
plt.show()
scale factor adjusting y1 is 2.7770496963040845
scale factor adjusting y2 is 0.6097911918241306
../_images/1D_examples_stitch_overlap_3_1.png
[ ]: